The Minerva Papers are a series by Jorge Padilla on competition law and economics in innovation-driven markets. Minerva, goddess of practical wisdom and patroness of crafts, stood for judgement joined to action and for the union of the academy and the workshop. Each paper takes one question that current enforcement handles by snapshot and proposes a method for handling it in motion. The series introduction is here, and every paper in the series is collected here.
Abstract. In innovation-driven markets, a market share records who is ahead; it does not reveal how hard that firm must work to remain ahead. A dominance assessment should therefore examine the incumbent’s innovation effort and the innovative capabilities of its challengers before treating persistent leadership as evidence of insulation from competition.
1. The challenge: static market positions fail to measure competitive pressure in innovation-driven markets
Competition law conditions the conduct of “dominant” firms, but its enforcement faces a problematic observational challenge. Economists can reliably measure the static position of a company in the market but are much less good at measuring the competitive pressure to which it is exposed. Market shares, margins and entry barriers describe the position occupied by firms in a properly specified market. They do not always reveal all competitive pressures to which those firms are subject. In a mature market, the challenge may be tolerable because a firm’s static position in the market may capture well its market power. This is because in such markets pressure usually appears through price reductions, output expansion, customer switching or entry. Instead, in an innovation-driven market, the gap between static market position as conventionally measured and market power can be large. A potential rival can discipline an incumbent long before it makes a sale; indeed, it may never make one because the incumbent innovates successfully in response.
This challenge has implications for the assessment of dominance in practice. The familiar Hoffman-LaRoche and United Brands formula asks whether a firm can behave to an appreciable extent independently of competitors, customers and consumers. Independence cannot sensibly mean literal freedom from every reaction. The economically meaningful question is whether the firm enjoys significant and durable freedom from competitive constraints. If innovation is the principal competitive parameter, the inquiry should include whether the firm can reduce its innovation effort without materially endangering its long-term market position. A firm that can enjoy the “quiet life” is in a different position from one that must spend heavily, take technological risks and repeatedly improve its products merely to stand still.
I therefore propose a reform that is modest in legal form but important in practice. The traditional dominance assessment should be supplemented by a structured R&D-intensity test. The test does not provide automatic immunity for large technology firms. It is not an efficiency defense to abusive conduct. It is not an unconditional safe harbor. It is an evidentiary module within the existing comprehensive assessment of dominance. Its purpose is to identify a competitive constraint that static indicators may miss: the credible threat of displacement through innovation.
2. The classical framework and the missing instrument
The classical approach to the assessment of dominance in EU competition law is more flexible than its critics sometimes suggest. Dominance is not unlawful; it is a precondition for Article 102 TFEU. It must be established at the time of the alleged abuse. The cases require a comprehensive survey rather than a mechanical checklist. In broad terms, the authority defines the relevant market; examines the firm’s share, the shares of its rivals and their evolution; assesses barriers to entry and expansion; considers countervailing buyer power; and cross-checks those structural indicators against evidence of competition in fact.
Market shares are the conventional starting point. Very high and persistent shares, a large gap over the nearest rival and a limited competitive fringe can support a strong inference of dominance. The AKZO presumption above 50 per cent remains legally important. But shares are proxies. Their significance depends on sound market definition, the metric used, product differentiation, capacity constraints, market maturity and durability. Even a firm with a very high share may be constrained if smaller rivals can expand rapidly. Conversely, a firm with a more modest share may possess lasting power when entry is blocked.
That makes entry and expansion the crucial durability inquiry. The standard catalogue is familiar: legal exclusivity, intellectual property, sunk costs, scale and scope economies, network effects, switching costs, access to data or other key inputs, brand, vertical integration, finance and ecosystem lock-in. Customers may counteract those advantages if they can switch, sponsor entry, multi-source or self-supply. Finally, actual market behavior provides a cross-check. An undertaking that repeatedly changes price or quality in response to rivals appears less independent than one that can alter terms with impunity.
Nothing in that classical architecture excludes dynamic evidence. The weakness is operational. In practice, present products and market shares organize the analysis; visible entry and changes in rank are treated as the natural evidence of contestability; and R&D frequently appears on only one side of the ledger, as a sunk cost that entrants must replicate or as proof of the incumbent’s superior technological and financial resources. Those can be valid inferences, but they are often incomplete. The same R&D expenditure can also be the cost of responding to a competitive threat. Without a method for distinguishing those interpretations, a competition authority may mistake successful defense of a market position for freedom from competition.
The European Commission’s 2024 Market Definition Notice provides a useful bridge. It recognizes innovation as a key parameter of competition, addresses pipeline products and earlier innovation efforts, and separates potential competition from immediate demand and supply substitution. Potential competition belongs in the competitive assessment, where the question is how it affects, or could affect, firm’s behavior. The R&D-intensity test proposed gives that question an operational answer.
3. Why stable shares can coexist with dynamic competition
Dynamic competition is competition for the market through a sequence of innovation races, rather than competition only in the market on price and output. The winner may obtain most sales for a period because its innovation creates or transforms demand. That market power is the prize that makes risky investment worthwhile. Yet the winner’s profits also become the prize in the next race. A challenger need not offer a close substitute to today’s product. It may attack from an adjacent technology, a different business model or a new ecosystem.
This changes the interpretation of persistence. Sir John Vickers showed that sequential innovation races can generate increasing dominance. If losing the next race would expose the incumbent to intense product-market competition and destroy a large profit stream, the incumbent has an especially strong incentive to invest. It may outspend or out-execute challengers, win again, and increase its share. The observed concentration is then compatible with a vigorous contest; it may be its outcome. Market shares tell us who won each race, not whether the race was run.
The empirical evidence in a recent paper I wrote with Douglas Ginsburg and Koren Wong-Ervin illustrates the point. Between 2000 and 2022, the combined annual R&D expenditure of Microsoft, Alphabet, Amazon, Meta and Apple increased from $4.4 billion to $200 billion. Their aggregate R&D-to-revenue ratio was 13.1 per cent in 2000 and 13.2 per cent in 2022, despite the enormous expansion and consolidation of their businesses. The ratio was not constant – it fell to 7.4 per cent in 2011 before recovering – and individual stories differ. Yet there is no secular decline of the kind predicted by a simple quiet-life hypothesis.
That evidence is suggestive, not dispositive. As Gilbert and Newbery’s seminal paper shows monopolist may innovate to protect rents; some R&D may reduce interoperability or raise rivals’ costs; expenditure measures inputs, not consumer value; and technological opportunities, regulation, tax rules, acquisitions and demand growth may affect investment. But these qualifications cut against an automatic inference in either direction. High shares cannot prove insulation, and high R&D cannot disprove dominance. The task is to identify when R&D is reliable evidence that innovative threats materially condition the incumbent.
4. A practical R&D-intensity test
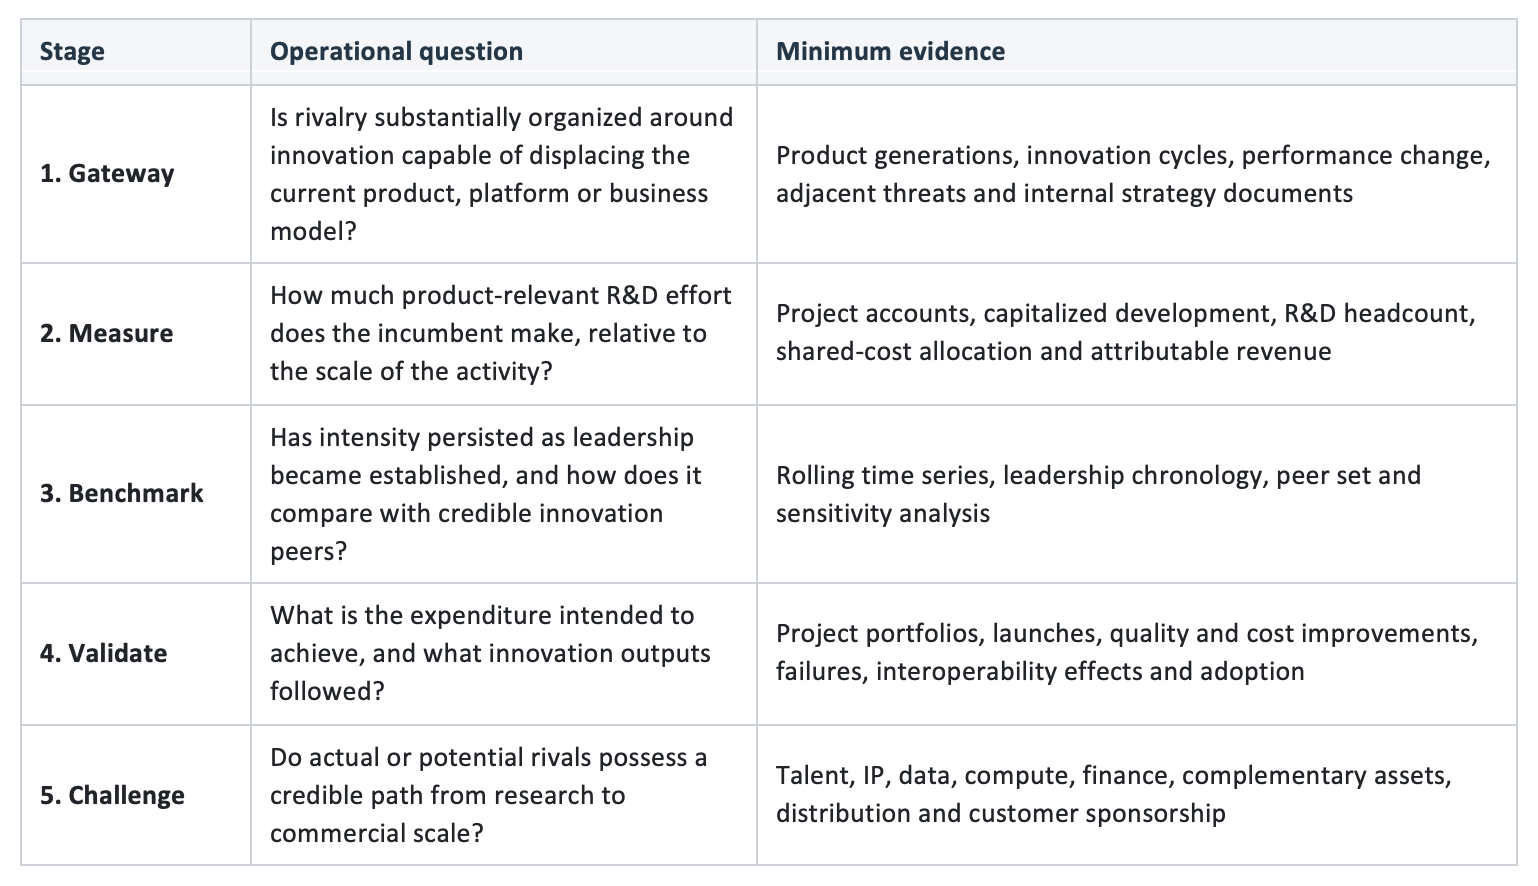
The proposed test has five stages: an applicability gateway; the construction of an adjusted, product-level measure; a longitudinal and comparative benchmarking exercise; the validation of the nature and output of the expenditure; and an assessment of challenger capability. Only then should the evidence be integrated with market shares, barriers and outcomes for the assessment of dominance.
4.1 The applicability gateway
The test should not be applied merely because the firm in question calls itself a technology company. It is appropriate when innovation is a central parameter of rivalry and a significant innovation can displace the incumbent’s product or erode the economic rents associated with its installed base. Relevant indicators include short product generations; substantial and uncertain R&D programmes; rapid improvements in quality-adjusted performance; competition between pipelines or technological capabilities; winner-take-most outcomes; and credible threats from adjacent products or business models.
The gateway should also identify the correct competitive arena. It may coincide with the legally defined relevant product market, but it need not. Early research can serve several future products, and an ecosystem may be constrained by innovation originating outside a narrow current market. The unit should be the product, platform, technology family or innovation space in which resources are actually committed and threats are assessed. Market definition must structure the inquiry, not operate as a guillotine that excludes relevant dynamic constraints.
4.2 Constructing the measure
The headline ratio is straightforward. For product or activity, a, in period t:
R&D intensity(a,t) = adjusted product-level R&D expenditure(a,t) / attributable revenue(a,t)
The apparent simplicity conceals most of the work. The numerator should start with internally expensed R&D and add current capitalized development costs, while excluding the later amortization of those same costs. It should allocate common research – for example, a shared AI model, cloud infrastructure or security platform – according to documented usage, engineering time or another causal driver. It should identify separately acquisition-related in-process R&D, integration costs, stock-based compensation and exceptional charges. After a material acquisition, the series should be shown on a consistent pro forma perimeter; purchase consideration and one-off write-offs are not current innovation effort. Expenditure that accounts describe broadly as “technology and content” should not be accepted uncritically. The authority should be able to reconcile the adjusted measure to audited accounts and then descend to business-unit and project ledgers.
The denominator must match the numerator. Firm-wide R&D divided by group revenue is a poor measure for a diversified undertaking. The preferred denominator is revenue attributable to the product or ecosystem under examination, including revenue earned on the monetized sides of a zero-price platform. Gross profit or value added may be a useful sensitivity measure where pass-through revenue or very different business models distort sales. For pre-revenue technologies, intensity is not meaningful; absolute expenditure, engineering headcount, compute usage and investment relative to the addressable opportunity should carry more weight.
No ratio should be read alone. The file should contain at least four parallel series: adjusted R&D intensity, real absolute R&D expenditure, R&D personnel or technical effort, and an output series. Absolute spending guards against denominator effects: rapid revenue growth may reduce intensity even when research expands substantially. It also reveals capability asymmetries: an incumbent and entrant can have identical ratios while the incumbent spends one hundred times more, a gap that may itself be an endogenous sunk-cost barrier. Headcount and project milestones test the accounting classification. Output measures might include important product introductions, improvements in performance or security, reductions in quality-adjusted price, adoption, and documented but unsuccessful experiments. Patent counts and citations can assist in some industries, but they are not a general substitute for the underlying project evidence.
The period should cover at least one full innovation cycle and normally five to ten years. Annual figures are noisy, so three-year rolling averages should be used. The analysis should align the time series with the period in which the firm built its position, the point at which leadership became established, major entry threats, technological discontinuities, acquisitions and regulatory changes. Currency, inflation and material accounting changes must be normalized.
4.3 Benchmarking persistence rather than selecting a universal percentage
There should be no universal pass mark. Thirteen per cent is not a safe harbor simply because it describes the aggregate ratio of five large technology firms in 2022. Research productivity, accounting rules and technological opportunity differ across sectors and over time. The strongest benchmark is the firm’s own behavior during a mature but demonstrably competitive period. A pre-revenue start-up phase is usually unsuitable because low sales mechanically inflate the ratio.
One useful summary is a persistence index:
Persistence index = average adjusted R&D intensity after leadership is established / average adjusted R&D intensity during the competitive build-out period
For investigative triage, not as a legal presumption, a three-year average at or above 90 per cent of the baseline may be treated as a green signal; 75 to 90 per cent as amber; and below 75 per cent for three consecutive years as a red signal requiring explanation. Those bands are deliberately relative. They should be tested against alternative baseline years and against absolute spending and headcount and should not be used where ordinary volatility or allocation error is larger than the relevant band. A red signal may disappear if a major project moves from development to commercial deployment; a green signal may be misleading if revenue has collapsed.
Two external comparisons should complement the self-benchmark. The first is a matched set of firms exposed to similar technological opportunities, including actual rivals, plausible entrants and firms in adjacent innovation spaces. The second is an innovation-frontier comparison with sectors in which competition for successive products is well established. Pharma may be informative for some technology markets, but it is not a universal yardstick. Peer selection should match technological risk, development duration, capital intensity and accounting treatment, rather than industry labels alone.
The relevant question is not merely whether the ratio is high. It is whether intensity remains substantial as shares, margins or installed-base advantages increase, and whether it reacts to credible threats. Event analysis around a rival’s funding, product announcement or technical breakthrough can be revealing. So can contemporaneous documents: board papers that increase research budgets because a nascent technology might bypass the installed base are direct evidence of perceived constraint. An econometric analysis may control technological opportunities, market growth, the cost of capital, tax changes, acquisitions and regulation, but the test need not identify potential entry as the sole cause of every euro of R&D. It asks whether the incumbent behaves as if innovation can materially threaten it.
4.4 Validating the direction and value of R&D
Expenditure is ambiguous until its purpose is understood. Project-level evidence should classify R&D into at least four functional groups: improvements to existing products and processes; new products or entry into adjacent activities; shared or general-purpose research; and defensive, compliance or ecosystem-control projects. The classification should use ex-ante project objectives, budgets and internal decision documents, not labels created for the investigation.
Both sustaining and radical innovation can benefit consumers. The right question is not whether an incumbent’s innovation changes market structure; that definition would make incumbent innovation non-disruptive by construction. The relevant questions are whether projects seek to improve quality, choice, security or cost; create new products or capabilities; and respond to alternatives consumers may plausibly adopt. Failed projects should remain in the numerator. Failure is inherent to genuine research and excluding it would reward only ex-post success.
Conversely, spending that reduces interoperability, closes interfaces, degrades multi-homing, accumulates data solely to deny it to rivals, or designs incompatibility may strengthen rather than weaken the dominance inference. The authority should examine whether the same project creates consumer benefits and raises barriers and should not force a binary label where effects are mixed. High R&D is probative of dynamic constraint only to the extent that the expenditure represents genuine innovative effort and is connected to dimensions on which present or future rivals compete.
Outputs provide corroboration, not a mechanical productivity test. It would be perverse to infer dominance from a costly failure or absence of dominance from a single successful launch. Over the full period, however, persistently high spending with no identifiable research pipeline, product improvement or experimental failure deserves skepticism. So does a portfolio concentrated on protecting distribution and control points rather than improving the user proposition.
4.5 Testing challenger capability
Incumbent effort is only half of the mechanism. A firm may spend heavily because it has abundant cash, attractive technological opportunities or an internal preference for expansion. The dynamic-constraint inference becomes materially stronger if outsiders possess the capabilities needed to impose the threatened loss.
In this context, “capability” should not be confused with the mere possession of assets. Petit and Teece, drawing on the dynamic-capabilities literature, distinguish ordinary capabilities—the firm-specific skills, knowledge, routines and experience required to develop, produce, market and sell current products—from dynamic capabilities: the higher-order, partly tacit capacity to sense technological and demand shifts, seize opportunities through investment and business-model choices, and transform or reconfigure assets as conditions change. Strong incumbent capabilities may explain repeated innovation-led success but may also make leadership more durable; they neither establish nor rebut dominance by themselves. R&D expenditure, IP, data, compute, finance and specialist personnel identify inputs; they do not establish that a challenger can combine them into a viable product, commercialize it, scale it and adapt over successive innovation cycles. Conversely, modest current sales need not imply a weak competitive constraint where those capabilities are demonstrably present.
The assessment should map actual and potential challengers’ intellectual property, specialist teams, funding, data and compute, access to inputs, complementary products, distribution and route to customers. It should include adjacent firms that could redirect capabilities, start-ups that could scale through cloud or app-store distribution, open-source projects, and customers able to sponsor entry. The issue is not whether entry is certain. Innovation threats are often low-probability but high-impact. Their expected discipline depends on the probability of displacement multiplied by the profits at risk. A relatively small annual hazard may rationally induce substantial defensive innovation.
Internal evidence again matters. An incumbent may understand a future threat better than the authority. Competitive intelligence, acquisition reviews, talent strategies and contingency plans can show whether a challenger is taken seriously before conventional entry criteria are satisfied. At the same time, the authority should test whether the challenger can cross the gap from technical possibility to commercial scale. A laboratory capability without finance, complementary assets or customer access may be too remote to constrain behavior.
4.6 Drawing the inference
The result should be graded, not binary. High and persistent product-level R&D intensity, valuable innovation output and credible challenger capabilities materially weaken an inference of dominance drawn from stable shares alone. High group-wide expenditure with opaque allocation, few consumer-facing outputs or no plausible external threat is neutral. A sustained, unexplained decline in R&D intensity after leadership is established, combined with weak challenger capability and reinforced entry barriers, strengthens the conventional structural inference. Low incumbent intensity in the face of a rapidly advancing challenger may instead show that the incumbent’s current share is vulnerable and transitory.
This is why the R&D-intensity test is best understood as a test of evidentiary weight. It does not ask the authority to choose between structure and conduct. It asks it to explain the whole pattern: shares, barriers, innovation effort, challenger capability and market outcomes. An inference that cannot account for a market leader’s costly response to an identified technological threat is incomplete.
5. Two stylized applications
Consider first a platform with an 80 per cent share that has remained broadly stable for seven years. Network effects, data advantages and customer switching costs support a prima facie structural case. Firm-wide R&D is 14 per cent of revenue, but that fact alone changes little. Product-level evidence then shows that the platform’s three-year R&D intensity is 105 per cent of its competitive build-out baseline; real expenditure and engineering headcount have doubled; projects have generated measurable improvements and new services; and board documents describe investment prompted by an adjacent AI-based mode of distribution. Several well-funded challengers possess the models, talent and access to users needed to bypass the platform’s conventional interface. Dominance is not automatically disproved. But the stable share can no longer be treated as self-validating evidence of insulation. The authority must confront the possibility that repeated innovation, rather than the absence of a race, explains persistence.
Now change the facts. The platform’s product-level intensity has fallen from 12 to 6 per cent over successive three-year averages while revenue and margins rise. Technical headcount is flat. Most remaining expenditure concerns closing interfaces and migrating users to proprietary formats. Major projects improve monetization but not quality; potential entrants lack access to a critical input and customers cannot sponsor an alternative. Here R&D evidence reinforces the structural case. The incumbent increasingly behaves as if it can protect rents without running the next innovation race.
The contrast shows the value of the framework. The headline share is identical, and both firms may report substantial research spending. What differs is the trajectory, allocation and competitive meaning of that effort.
6. Legal integration and safeguards
The proposed test fits within, rather than displaces, the law’s comprehensive survey. It is principally relevant to three established questions: whether apparent market power is lasting; whether potential entry and expansion constrain the undertaking; and whether actual behaviour corroborates independence. In an innovation market, R&D response performs a role analogous to price response in a mature market. It can reveal that a firm which appears structurally insulated is nevertheless reacting to competitive pressure on the parameter that matters most.
The authority retains the burden of establishing dominance. Where high and stable shares support a prima facie inference, the firm should produce auditable product-level R&D schedules, allocation rules and project documents if it wishes to rely on dynamic constraint. The authority can then test the evidence using investigatory powers unavailable to outside researchers. Opacity should reduce the weight of the claim, but a company’s failure to construct accounting categories that antitrust law has never previously required should not in itself prove dominance.
Four safeguards are essential. First, the test applies only after the innovation gateway is satisfied. Second, no universal ratio or composite score determines the legal conclusion. Third, R&D evidence must be separated from the alleged abuse to avoid circularity: investment cannot excuse exclusion, and alleged exclusion should not establish the market power that makes it unlawful. Fourth, the direction of causation remains open. The same project may be a response to rivalry, a source of efficiency and a means of raising barriers. The assessment must recognize mixed effects.
Most importantly, passing the test is not a license to engage in anticompetitive conduct. Future creative destruction does not legalize present exclusion. A firm may be dynamically constrained and still dominant; it may also innovate intensely while using control over a bottleneck to suppress rivals. The test addresses the anterior question of whether the firm possesses durable power and the evidentiary weight that can be placed on structure. Abuse and objective justification must then be assessed on their own terms.
7. Conclusion: from snapshots to motion
The classical framework asks the right ultimate question: can the firm materially disregard competitive constraints? Its weakness in dynamic markets is not conceptual but empirical. It relies too readily on snapshots when competition occurs in motion.
An R&D-intensity test can make the dynamic inquiry administrable. Properly applied, it is demanding product-level rather than group-wide; longitudinal rather than a single ratio; benchmarked rather than universal; validated by projects and outputs; and completed by evidence of challenger capability. It can support either conclusion. Persistent, threat-responsive innovation may reveal a market leader working hard because its position is contestable. Declining or strategically defensive effort may reveal the quiet life behind a high share.
Dominance analysis should not confuse winning repeatedly with running unopposed. Nor should it romanticize R&D expenditure by incumbents. The task is to determine what the spending, the projects and the surrounding capabilities say about constraint. Market shares remain relevant, but in innovation-driven markets they should be the beginning of the inquiry, not its end.
**
Selected references
- Commission, Notice on the Definition of the Relevant Market for the Purposes of Union Competition Law [2024] OJ C/2024/1645.
- Richard J Gilbert and David M G Newbery, ‘Preemptive Patenting and the Persistence of Monopoly’ (1982) 72 American Economic Review 514.
- Jorge Padilla, Douglas H Ginsburg and Koren Wong-Ervin, ‘Dynamic Competition and Antitrust: Quick-Look Inferences from the Analysis of Big Tech’s R&D Expenditure Ratios’ (2025) 86 Antitrust Law Journal 897.
- Nicolas Petit and Thibault Schrepel, ‘Complexity-Minded Antitrust’ (2023) 33 Journal of Evolutionary Economics 541.
- Nicolas Petit, Thibault Schrepel and Bowman Heiden, ‘Situating the Dynamic Competition Approach’ (2026) 71 The Antitrust Bulletin 3.
- Nicolas Petit and David J Teece, ‘Capabilities Checklist for Mergers with Nascent Competitors’ (2023) 14 Journal of European Competition Law & Practice 135.
- Nicolas Petit and David J Teece, ‘Capabilities: The Next Step for the Economic Construction of Competition Law’ (2024) 15 Journal of European Competition Law & Practice 513.
- Thibault Schrepel, ‘A Systematic Content Analysis of Innovation in European Competition Law’ (2024) 58 European Journal of Law and Economics 355.
- David J Teece, Gary Pisano and Amy Shuen, ‘Dynamic Capabilities and Strategic Management’ (1997) 18 Strategic Management Journal 509.
- John Vickers, ‘The Evolution of Market Structure When There Is a Sequence of Innovations’ (1986) 35 Journal of Industrial Economics 1.
- Case 27/76 United Brands Company and United Brands Continentaal BV v Commission EU:C:1978:22.
- Case 85/76 Hoffmann-La Roche & Co AG v Commission EU:C:1979:36.
- Case C-62/86 AKZO Chemie BV v Commission EU:C:1991:286.